
Introduction: Why Metrics Are the Backbone of a Profitable Self-Storage Business
Self-storage has delivered an average annual return of 11.6% since 2006, the highest of any NCREIF property type. That sector-wide performance, though, doesn't automatically flow to individual facilities.
The most common mistake owners make is fixating on physical occupancy while ignoring the financial metrics that determine whether a facility is actually profitable. A unit count at 92% capacity can still bleed cash if delinquency is high, expenses are out of control, or rates are below market.
This guide covers the metrics that matter most: occupancy, NOI, revenue per square foot, cap rates, expense ratios, and market demand signals. Whether you're an active operator, a first-time acquirer, or an investor evaluating a purchase, these numbers tell you exactly where a facility stands — and what it will take to make it perform.
TLDR: Key Self-Storage Metrics at a Glance
- Physical occupancy: Percentage of units currently rented; target 85–90%+ for a stabilized facility
- Economic occupancy: Percentage of potential gross income actually collected — a more accurate read on profitability than unit count alone
- NOI: Total revenue minus operating expenses; self-storage expense ratios typically run 25–40% of gross income
- Cap rate: NOI ÷ property value; ranges from ~5% in primary markets to 7%+ in secondary markets
- Revenue per occupied sq ft: Gross rental income divided by rented square footage
Occupancy Metrics: Physical vs. Economic Occupancy
Physical Occupancy
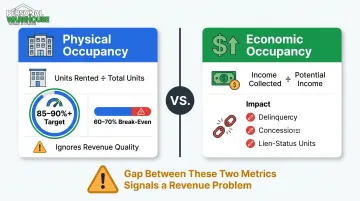
Physical occupancy is the most commonly cited self-storage metric: the percentage of units (or square footage) currently rented out of total available. If you have 200 units and 170 are rented, physical occupancy is 85%.
Physical occupancy tells you how full your facility is, not how much money it's actually generating. It's one data point — a starting place, not a complete picture.
Current benchmark: National average physical occupancy at stabilized facilities was 77.0% in Q4 2025, with regional variation — the West averaged ~79.8% while the South ran closer to 75.0%. The widely cited operational target for a healthy, stabilized facility is 85–90%+.
Most facilities reach the break-even point — covering all operating expenses — at approximately 60–70% physical occupancy. Above that threshold, additional revenue flows directly to profit, which is why self-storage cash flows tend to improve quickly once a new facility stabilizes.
Economic Occupancy
Economic occupancy is the metric physical occupancy can't show you. It measures the percentage of potential gross income actually being collected — accounting for concessions, delinquencies, and vacancies.
A facility can sit at 90% physical occupancy while posting economic occupancy of 75% or lower if:
- Tenants are behind on payments (delinquency)
- Aggressive move-in promotions are dragging effective rent down
- A portion of "rented" units are in lien or auction status
Tracking both numbers side by side is non-negotiable. High physical occupancy paired with low economic occupancy signals a revenue problem, not a capacity success. Operators who monitor delinquency separately — and respond quickly through automated late notices, payment reminders, and lien processes — protect their cash flow before small gaps compound into larger ones.
Revenue and Income Metrics: NOI and Revenue Per Square Foot
Net Operating Income (NOI)
NOI is the single most important financial metric for any self-storage operator. The formula is straightforward:
NOI = Total Revenue − Operating Expenses
Operating expenses include property taxes, management fees, payroll, utilities, insurance, marketing, and maintenance — but exclude debt service, depreciation, and capital expenditures. That exclusion matters because NOI measures the property's operational performance independent of how it's financed.
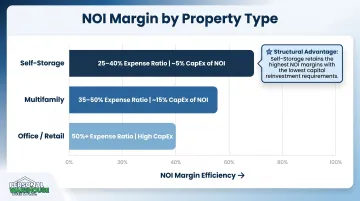
The SSA Primer confirms operating costs average 25–40% of stabilized income for self-storage, and TractIQ's 2024 expense data pegs the national average operating expense ratio at 34.68%. That means a well-run facility keeps 60–75 cents of every revenue dollar as NOI, margins that outperform most other commercial real estate property types.
For comparison, multifamily typically runs 35–50% expense ratios, and office and retail run higher still with far greater capital expenditure needs. Self-storage's capital-light model is a genuine structural advantage: Nareit data shows self-storage capex runs roughly 5% of NOI versus ~15% for other sectors.
Revenue Per Occupied Square Foot
Once you have a clear NOI baseline, tracking revenue per occupied square foot gives you a sharper read on pricing performance. Calculate this monthly: divide gross rental income by total square footage of currently rented units. Collecting $18,000/month on 10,000 occupied square feet puts your revenue per occupied sq ft at $1.80/month.
Yardi Matrix reports the national annualized advertised asking rate at $16.07 per square foot as of March 2026 — or roughly $1.34/month. That's your market benchmark. If you're running below it, you likely have room to push rates. If you're above it, your mix of climate-controlled or premium units is probably driving outperformance.
Beyond Base Rent: Ancillary Revenue
NOI improvement doesn't always require raising occupancy. Revenue diversification can lift income without adding a single tenant:
- Tenant protection/insurance programs — typically generate 5–6% of store revenue, or $8–9 per customer
- Late fees and admin fees — direct to NOI with minimal cost
- Moving supplies, locks, truck rentals — lower margin but volume-driven
- Combined ancillary impact — Inside Self-Storage reports these streams can lift total income by as much as 10%
The T-12 Baseline
Never evaluate a facility's financial performance from a single month's snapshot. Trailing 12-month (T-12) revenue analysis smooths seasonal variation and reveals true operating trends. For acquisition due diligence, three full years of financials paired with a current rent roll gives the clearest view of how a facility performs through different market conditions.
Where Ownership Structure Affects NOI
For operators who own their space rather than lease it, NOI forecasting becomes significantly more predictable. A fixed-rate mortgage — versus a lease subject to renewal, rent escalation, or landlord decisions — creates a stable cost baseline that doesn't shift with market conditions.
Personal Warehouse units, available through SBA 504 and 7(a) financing with terms comparable to residential loans, illustrate this well. The 99-year ground lease structure removes land cost uncertainty entirely, locking in one of the largest potential variables in long-term operating cost projections.
Valuation and Investment Return Metrics
Cap Rate
The capitalization rate is how the market prices self-storage income:
Cap Rate = NOI ÷ Property Value
A facility generating $200,000 NOI that sells for $3.3M sold at a 6.1% cap rate. Cap rates let you compare self-storage opportunities to each other and to other asset classes on a consistent basis.
Current benchmarks from the Cushman & Wakefield H2 2024 Investor Survey:
| Market Tier | Cap Rate Range |
|---|---|
| Class A, Top 30 MSA | 5.0–6.0% |
| Class B, Primary Markets | 5.0–6.49% |
| Class B, Secondary Markets | 5.5–7.0% |
Lower cap rates reflect lower-risk, high-demand markets. Rural or secondary market deals often trade at 7%+ — higher yield, but with more demand risk baked in.
The Valuation Formula That Matters Most
Once you understand cap rates, a critical truth about self-storage management clicks into place:
Property Value = NOI ÷ Cap Rate
At a 6% cap rate, every $10,000 increase in annual NOI adds approximately $167,000 in property value. That means:
- Reducing delinquency by 2% on a $500,000 revenue facility adds $10,000 to NOI
- Adding a tenant protection program generating $15,000/year in new revenue adds $250,000 in value
- Cutting unnecessary operating expenses by $20,000 adds $333,000 in value
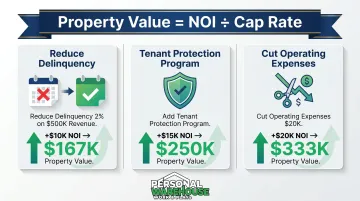
Operators who track NOI closely — not just occupancy — build property value with every operational decision they make.
Cash-on-Cash Return and DSCR
Cash-on-cash ROI measures annual pre-tax cash flow divided by total cash invested. For leveraged buyers, this often matters more than cap rate — it reflects actual return on deployed capital, not total asset value.
Debt Service Coverage Ratio (DSCR) = NOI ÷ Annual Debt Payments. Most lenders require a minimum 1.25x DSCR for self-storage financing. Key thresholds to know:
- Above 1.25x: Facility supports its debt load — lenders are comfortable
- Below 1.25x: Signals debt stress, triggering problems with current lenders and refinancing options
If your NOI is $150,000 and annual debt payments are $100,000, your DSCR is 1.5x — comfortably above the threshold.
Operational Cost Metrics: Controlling Your Expense Ratio
Primary Expense Categories
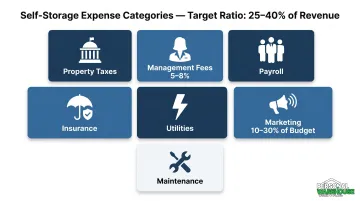
A well-run self-storage facility typically tracks these cost buckets:
- Property taxes — often the largest single line item
- Management fees — typically 5–8% of gross revenue for third-party management
- Payroll — variable based on staffing model (on-site vs. remote/kiosk)
- Insurance — business and liability coverage
- Utilities — electricity, water, lighting; reduced significantly by energy-efficient infrastructure
- Marketing — PPC and digital can run 10–30% of the total marketing budget
- Maintenance — lower for newer or well-built facilities
Operating Expense Ratio
Operating Expense Ratio = Total Operating Expenses ÷ Gross Revenue
TractIQ's 2024 data puts the national average at 34.68%. A well-run facility should target the lower end of the 25–40% range.
An expense ratio above 50% signals either excessive overhead, management inefficiency, or underperforming revenue — all warning signs for potential buyers evaluating a purchase.
Delinquency as a Standalone Metric
Delinquency rate — the percentage of tenants behind on payments — deserves its own tracking line, separate from economic occupancy. High delinquency suppresses collected revenue, increases administrative burden, and during due diligence, can signal weak management practices that a new owner will need to resolve.
For context: CMBS loan-level delinquency for self-storage was just 0.1% as of September 2025, versus 6.6% for the overall CMBS market — suggesting that well-operated self-storage facilities maintain exceptionally clean credit profiles.
Market and Demand Metrics: Understanding Your Position
Square Footage Per Capita
This supply-side metric screens for market saturation before you commit to a location or expansion:
Sq Ft Per Capita = Total Storage Sq Ft in Trade Area ÷ Local Population
The commonly cited saturation signal is ~8 sq ft per capita. Current real-world examples show wide variation: Houston runs ~11.5 sq ft per capita (oversupplied), while New York City sits at ~4.1 sq ft per capita (undersupplied). Markets below 8 sq ft per capita have more room to absorb new supply without competing on price.
Competitive Occupancy as a Demand Signal
Before building, buying, or expanding, check what nearby facilities are actually achieving. Occupancy rates across your trade area tell the story quickly:
- 85%+ across multiple operators: Unmet demand exists — the market can absorb new supply
- Low-to-mid 70s across multiple operators: The market is likely already stretched; new supply will compete on price, not demand
Seasonal Patterns
Self-storage demand follows residential moving cycles. Peak rental season runs May through September, driven by summer relocations, college moves, and home sales. February is the slowest month for new rentals and price realization.
This seasonal rhythm means month-over-month benchmarking is more useful than year-over-year comparisons during transition periods. An occupancy dip from October to January is normal; the same dip from April to June is a problem worth investigating.
Putting It All Together: Building Your Metrics Dashboard
Tracking these metrics in isolation provides limited value. The goal is a coordinated view across time horizons:
| Cadence | Metrics to Track |
|---|---|
| Weekly | Physical occupancy, delinquency rate, new move-ins/move-outs |
| Monthly | Economic occupancy, gross revenue, NOI, revenue per sq ft, ancillary income |
| Quarterly | Expense ratio, cap rate (implied), DSCR, competitive occupancy comparison |
| Annually | T-12 analysis, valuation update, market per-capita supply check |
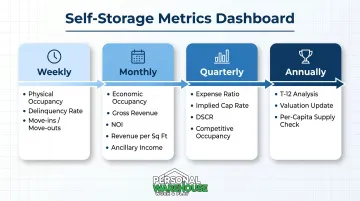
This cadence converts reactive management — noticing a problem after it's damaged your financials — into proactive decision-making where you spot trends early and respond before they compound.
For owners who hold their space rather than lease it, these metrics carry additional weight. Every improvement to NOI directly increases asset value, and every dollar saved on expenses flows to both current cash flow and eventual resale price.
Personal Warehouse spaces are built with this investment logic in mind. Features like all-LED lighting, superior insulation, commercial-grade insulated overhead doors, and individually metered utilities reduce ongoing utility costs and simplify expense tracking.
Customizable mezzanines expand usable square footage by up to 30% without adding to the building's footprint. For owners who choose to lease their units, that's a direct improvement to revenue per occupied square foot — without a larger building to maintain.
Frequently Asked Questions
How do you determine the value of a self-storage business?
Value is primarily calculated using the formula: Value = NOI ÷ Cap Rate. A facility's T-12 revenue, current rent roll, and expense history — combined with local market cap rates — are the core inputs. Buyers and appraisers typically require at least two to three years of audited financials.
How much do storage unit business owners make?
Profit varies widely by facility size, location, occupancy, and operational efficiency. With expense ratios averaging 25–40% of gross income, a well-run facility generating $500,000 in revenue can produce $300,000–$375,000 in NOI — though smaller facilities and those still in lease-up earn considerably less.
What is a good occupancy rate for a self-storage facility?
A healthy, stabilized facility targets 85–90%+ physical occupancy, though most cover operating expenses at 60–70%. Economic occupancy — which accounts for delinquency and concessions — is the more complete measure of financial health.
What is net operating income (NOI) in self-storage?
NOI equals total revenue minus operating expenses, excluding debt service, depreciation, and capital expenditures. Self-storage benefits from one of the highest NOI margins in commercial real estate, with operating costs running roughly 25–40% of gross income.
What cap rate should I expect for a self-storage investment?
Cap rates vary by market tier: Class A facilities in top 30 MSAs trade at approximately 5.0–6.0% as of 2024, while Class B secondary-market facilities typically range from 5.5–7.0%. A lower cap rate reflects a lower-risk, higher-demand market — and a higher purchase price relative to income.
What is the difference between physical and economic occupancy?
Physical occupancy measures what percentage of units are rented; economic occupancy measures what percentage of potential income is actually collected. A facility with high physical occupancy but significant delinquency or concessions will show a meaningful gap between the two — and that gap directly reduces actual cash flow.